
Introducing SCI: Custom Insights: Turn Your Transportation Network Into Actionable Intelligence
SONAR launches SCI: Custom Insights, combining shipper transportation data with market benchmarks to reveal savings, risk and network performance. The post Introducing SCI: Custom Insights: Turn Your Transportation Network Into Actionable Intelligence appeared first on FreightWaves.
Source Lens
Industry Context
Useful background context, but lower-priority than direct platform, community, or operator intelligence.
Impact Level
medium
Use this briefing to decide whether your team needs an immediate workflow, policy, or reporting change.
Key Stat / Trigger
No single quantitative trigger surfaced in this report.
Focus on the operational implication, not just the headline.
Full Coverage
Shippers have more transportation data than ever — but having the data and knowing what to do with it are two very different things. Tender activity, carrier acceptance, rates, volume, market conditions and routing guide performance often live in separate systems and get analyzed separately.
That makes it hard to see where a network is performing well, where risk is building, and where there’s an opportunity to cut cost. That’s the problem SCI: Custom Insights is built to solve.
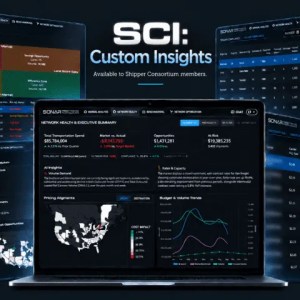
SCI: Custom Insights is a new consortium-powered experience within SONAR’s Supply Chain Intelligence that combines a shipper’s own transportation data with SONAR’s market benchmarks to deliver an ongoing view of network performance.
It’s available to participating members of the SONAR Shipper Consortium, and it helps shippers move from a high-level view of network health down to the individual markets, lanes and carriers driving results.
From Transportation Data to Network Intelligence Participating shippers contribute transportation data — tendered volume, accepted and rejected tenders, carrier information, rates and other network activity.
SCI: Custom Insights brings that data together with SONAR market intelligence so teams can answer questions like: Where are we paying above or below market? Which lanes offer the greatest savings opportunity? Where could pricing be creating capacity or service risk? Are carriers accepting the freight we expected them to?
Is actual volume tracking with what was planned or awarded? Which markets are driving network cost or risk? Which carriers or lanes should we evaluate first? Rather than answering those questions in isolation, Custom Insights connects them across three areas: Network Health, Benchmarking and Network Optimization.
Network Health: See the Bigger Picture Network Health is the starting point, giving users an executive-level view of the transportation network — total spend, market vs. actual spend, savings opportunities, at-risk spend, total volume, network risk, tender compliance, pricing alignment, and budget and volume trends.
The page also layers in SONAR market context and AI-driven insights on demand, rates and capacity, so users can quickly see what’s changing and where to look next. Benchmarking: Find the Lanes That Need Attention Benchmarking takes the analysis down from the network level to individual lanes.
Lane Opportunities combines pricing alignment, lane difficulty, tender acceptance and market conditions to sort lanes into four categories: High Risk Zone, Savings Opportunity, Carrier-Dependent Zone and Efficiency Zone — making it easy to spot where a shipper may be overpaying, where aggressive pricing could be creating service exposure, and where pricing and capacity are both working well.
Volume Compliance compares planned volume against actual volume so shippers can see where freight is surging, falling short or shifting from expectations — critical context for procurement and routing guide conversations.
A carrier performance issue looks very different if that carrier received far more freight than planned, just as a pricing decision may need a second look if the volume never materialized.
Network Optimization: Understand the Markets and Carriers Driving Performance Network Analysis groups activity by origin or destination market, letting users evaluate spend, volume, rate alignment, tender rejection conditions and compliance across facilities and markets — then drill into the specific lanes driving those results, to see whether an issue is isolated or part of a broader trend.
Carrier Intelligence gives a network-wide view of carrier performance — average rate, rate variance, tender acceptance, total volume, total lanes, average length of haul, risk level and guidance — with the ability to drill into any individual carrier to see exactly which lanes are driving its numbers.
Manual Analysis Isn’t Going Anywhere SCI: Custom Insights doesn’t replace the existing Supply Chain Intelligence workflow — it extends it. The original SCI experience now lives under Manual Analysis, and remains available for mini-bids, project freight, scenario analysis, new lanes, and any freight that isn’t yet part of a shipper’s ongoing consortium data.
That gives participating shippers both an ongoing view of their network and the flexibility to run one-off analysis whenever they need it. Built for the SONAR Shipper Consortium SCI: Custom Insights is available exclusively to participating members of the SONAR Shipper Consortium.
By contributing transportation data, members gain access to deeper network intelligence that supports procurement, carrier management, routing guide strategy and transportation planning. The value isn’t just more metrics — it’s connecting shipper-specific performance with market context so teams can identify what matters and know where to act.
Frequently Asked Questions What is SCI: Custom Insights? SCI: Custom Insights is a consortium-powered feature within SONAR’s
Original Source
This briefing is based on reporting from Freightwaves. Use the original post for full primary-source context.
Style
Audience