Last-mile costs rise 12% for a second year
Last-mile delivery costs rose 12% in 2026 for the second consecutive year, with 88% of operators reporting delivery costs growing as fast or faster than revenue. FedEx/UPS rate hikes account for ~6%, with the remaining 6% tied to operational inefficiencies.
This is sustained margin compression across the entire logistics stack -- sellers running FBM, hybrid fulfillment, or DTC alongside marketplace ops face a structural cost floor that won't reset, accelerating the shift toward FBA and platform-native fulfillment despite its own fee increases.
Sellers absorbing free shipping thresholds or flat-rate shipping promises built on 2024 cost assumptions are now structurally underwater — two years of 12% compounding means last-mile costs are 25%+ higher than pre-2025 baselines. Audit your shipping cost per order in Seller Central or your 3PL dashboard and compare against your current free shipping threshold to see if it still pencils out.
Operational Impact
This story may require teams to revisit workflows, monitoring, or platform assumptions.
Bottom Line
25% cumulative last-mile cost increase since 2024 is crushing FBM and DTC shipping margins.
Source Lens
Industry Context
Useful background context, but lower-priority than direct platform, community, or operator intelligence.
Impact Level
medium
25% cumulative last-mile cost increase since 2024 is crushing FBM and DTC shipping margins.
Key Stat / Trigger
12% median last-mile cost increase for the second consecutive year in 2026
Focus on the operational implication, not just the headline.
Full Coverage
CHICAGO — Last mile costs continue to rise. On Thursday, FarEye released new research putting that cost into perspective using survey data. The survey found median last-mile costs rose 12 percent in 2026, matching the increase operators saw a year ago.
Six in 10 operators reported increases above 10 percent, and one in five reported increases above 20 percent. Eighty-eight percent of operators said delivery cost is growing as fast as revenue or faster. Only one in eight operators is creating operating leverage.
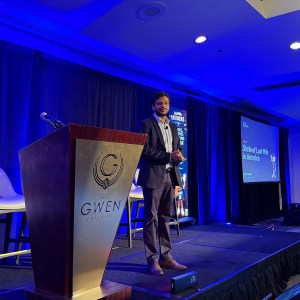
FarEye CEO and co-founder Kushal Nahata presented these findings Thursday at the Last Mile Leaders America event in Chicago. “We thought probably it’s an anomaly, it’s not in double digits, but we saw that again this year as well,” Nahata said.
“So now it’s probably the new normal that our delivery costs overall are increasing by almost double digits year on year.” window. googletag = window. googletag || {cmd: []}; googletag. cmd. push(function() {var gptSlot = googletag.
defineSlot('/21776187881/FW-Responsive-Main_Content-Slot1', [[300, 100], [320, 50], [728, 90], [468, 60]], 'div-gpt-ad-1709668545404-0'). defineSizeMapping(gptSizeMaps. banner1). addService(googletag. pubads()); googletag. pubads(). enableSingleRequest(); googletag. pubads(). collapseEmptyDivs(); googletag. enableServices(); setInterval(function() {if (!
document. hidden) {googletag. pubads(). refresh([gptSlot]); } }, 30000); }); googletag. cmd. push(function() {googletag. display('div-gpt-ad-1709668545404-0'); }); The survey gathered more than 3,000 data points from U. S. delivery operators in the first half of 2026. Control figures are based on the 41 operators who answered the control question.
Fleet-mix figures are based on 84 operators. Last-mile costs stay in double digits Operators most often placed fuel (70 percent), driver cost and availability (51 percent), and vehicle operating cost (40 percent) among their top three cost pressures. Inefficient routing made the top three for 21 percent. Failed deliveries and returns made it for 18 percent.
“This twelve percent is obviously a combination of about six percent, which is the public rates that were increased by FedEx, UPS,” Nahata said. “But along with that, this additional six percent which gets contributed by the operational inefficiencies that we have in our operations.” That 6-and-6 split is his on-stage accounting, not from the survey data.
One takeaway is these continued increases in costs continue to place pressures on these businesses. “Neither the CFOs nor the business allow us to operate at any cost,” he said. “The cost needs to come down as well.” That mandate to tackle costs showed up in the survey data.
Forty-five percent of operators put reducing delivery cost in their top three investment priorities, more than any other item. Companies above $1 billion in revenue posted a 13. 8 percent median cost increase, the highest of any size band. Reliability draws the promise Predictable delivery time and successful first-attempt delivery together accounted for 55.
7 percent of the promise operators said matters most. Fastest possible delivery accounted for 11. 4 percent. window. googletag = window. googletag || {cmd: []}; googletag. cmd. push(function() {var gptSlot = googletag. defineSlot('/21776187881/fw-responsive-main_content-slot3', [[728, 90], [468, 60], [320, 50], [300, 100]], 'div-gpt-ad-1665767553440-0').
defineSizeMapping(gptSizeMaps. banner1). addService(googletag. pubads()); googletag. pubads(). enableSingleRequest(); googletag. pubads(). collapseEmptyDivs(); googletag. enableServices(); setInterval(function() {if (! document. hidden) {googletag. pubads(). refresh([gptSlot]); } }, 30000); }); googletag. cmd. push(function() {googletag.
display('div-gpt-ad-1665767553440-0'); }); “What consumers are looking for, as we see it now, is speed along with certainty or reliability,” Nahata said. “The delivery promise is probably the biggest thing. That’s where consumers have moved.” The eight operators who put maximum speed first posted 76 percent on-time performance and a 24 percent cost increase.
Operators who put predictable delivery first posted 88. 4 percent on-time and a 10 percent cost increase. Visibility-first operators posted 90. 3 percent on-time and a 4. 9 percent cost increase. Where-is-my-order contact, or WISMO, moved with that cost pattern. Operators with WISMO rates above 30 percent posted 17. 2 percent cost inflation and 81.
4 percent on-time performance. Operators at 5 percent WISMO or less posted 7. 3 percent inflation and 86. 5 percent on-time. The high-WISMO group carried 2. 4 times the cost inflation of the low group. “WISMO probably is a good economic indicator of your last-mile cost as well,” Nahata said. “It’s not just about customer experience.”
Proactive delay notifications were the only customer-experience capability in the survey tied to better on-time performance, at 88. 1 percent with the notifications against 81 percent without them. window. googletag = window. googletag || {cmd: []
Pull your avg shipping cost per order in Seller Central > Reports > Fulfillment > Shipment Events -- if FBM shipping cost has risen 20%+ since 2024, raise your free shipping threshold or shift high-velocity SKUs to FBA to offset.
In the next 30 days, renegotiate carrier contracts or add a regional carrier (OnTrac, LSO, Spee-Dee) for zone 1-3 shipments to claw back 3-5% on the operational inefficiency half of the cost increase.
Original Source
This briefing is based on reporting from Freightwaves. Use the original post for full primary-source context.
Style
Audience