Freight Market Health: What 13.57% Rejections Mean
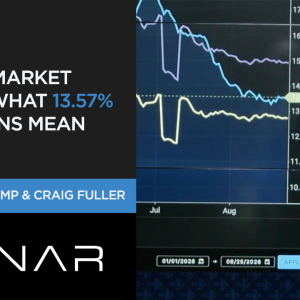
The freight market is stabilizing, with tender rejections at 13.57%. But don’t let this “healthy” period fool you; volatility is on the horizon. Learn what FreightWaves’ experts say about current market conditions, upcoming Q4 surges, and how this impacts shippers and carriers. Get ready for a dynamic end to the year. Truckload tender rejections have […] The post Freight Market Health: What 13.57% Rejections Mean appeared first on FreightWaves.
Source Lens
Industry Context
Useful background context, but lower-priority than direct platform, community, or operator intelligence.
Impact Level
medium
Use this briefing to decide whether your team needs an immediate workflow, policy, or reporting change.
Key Stat / Trigger
No single quantitative trigger surfaced in this report.
Focus on the operational implication, not just the headline.
Full Coverage
#fwtv_NoU9XSVdzhk. fwtv-panel{border:1px solid #d0d0d0;padding:18px;border-radius:6px;line-height:1. 6}#fwtv_NoU9XSVdzhk. fwtv-panel p{margin:0 0 12px}#fwtv_NoU9XSVdzhk. fwtv-note{font-style:italic;color:#666;margin-top:16px;padding-top:12px;border-top:1px solid #e0e0e0}The freight market is stabilizing, with tender rejections at 13. 57%.
But don’t let this “healthy” period fool you; volatility is on the horizon. Learn what FreightWaves’ experts say about current market conditions, upcoming Q4 surges, and how this impacts shippers and carriers. Get ready for a dynamic end to the year. Truckload tender rejections have settled near 13. 57% after spiking to a cycle peak above 17.
5% around the July 4th holiday, according to SONAR data reviewed on air by Craig Fuller and Julie Van de Kamp. The stabilization is drawing attention because it signals an orderly market heading into what has historically been a volatile fourth quarter for freight. Fuller described the current rejection rate as a healthy baseline — not a sign of weakness.
Brokers who use SONAR previously told the company that 8% tender rejections felt tight, but that threshold has shifted. “They said that 8% used to feel like — 8% tender rejections used to feel like, oh gosh, things are tight.
And now they feel like it’s more that 12% to 13% where things are tight and where they have a little bit more leverage with shippers in the market with tender rejections,” Fuller said. “This feels like a healthy market to really get your ducks in a row for what you want your spot contract mix to be.
Whether you’re a shipper, a broker, or a carrier, to have a minute to catch up and figure out, okay, this is what I want my spot contract mix to be, knowing there’s gonna be a little bit more volatility in the 4th quarter.”
— Craig Fuller The current reading represents a significant recovery from roughly 6% rejections recorded in January — a level Van de Kamp characterized as the cycle trough. She noted that the 13.
5% figure is likely a market floor for this cycle, arguing that rejection rates historically firm up through September, October, and November even in softer freight environments. Spot rates are already showing early signs of that firming.
SONAR daily spot rate data shows a 7% increase from August 22 through the morning of the broadcast, more than offsetting a dip earlier in the month. Over the full month, spot rates are down just 0. 3%, with early August showing a swing as high as 6% before the late-month rebound.
Van de Kamp pointed to several seasonal catalysts that could push rejection rates higher heading into fall: a later Labor Day, back-to-school freight surges in parts of the country that return after the holiday, and an anticipated earlier holiday peak season as retailers seek to move West Coast import freight sooner to avoid excess inventory risk.
She and Fuller also noted that the market is approaching the one-year anniversary of English proficiency enforcement and non-domiciled CDL crackdowns, making year-over-year comparisons in October a closely watched metric. For shippers and carriers, the current window of stability is being framed as an opportunity rather than a lull.
Accepted truckload volumes and overall tender volumes are moving in tandem — a pattern that SONAR data indicates is consistent with stable, predictable freight flow. Carriers are described as securing rate increases, while shippers are not facing freight left on the dock.
Fuller said volatility will return, but the near-term picture gives market participants time to set their spot-to-contract freight mix before conditions tighten. Tender rejections have stabilized near 13. 57% after peaking above 17. 5% around July 4th, up sharply from roughly 6% in January.
Spot rates rose 7% from August 22 through late August, signaling early seasonal firming ahead of Labor Day and fall freight surges. Brokers told FreightWaves SONAR that the ‘tight market’ threshold has shifted from 8% to the 12%-13% range for tender rejections.
This Summary is generated thanks to a transcription of the interview, for the full interview please enjoy the video above. The post Freight Market Health: What 13. 57% Rejections Mean appeared first on FreightWaves.
Original Source
This briefing is based on reporting from Freightwaves. Use the original post for full primary-source context.
Style
Audience