J.B. Hunt experiences growing pains in Q3
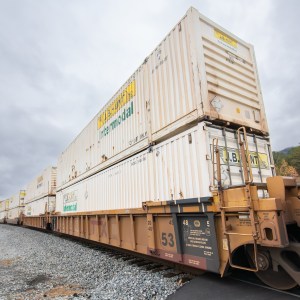
J.B. Hunt Transport Services’ third quarter displayed growth pains and other cost pressures, but management said this was likely a speed bump on the road to recovery. The post J.B. Hunt experiences growing pains in Q3 appeared first on FreightWaves.
Source Lens
Industry Context
Useful background context, but lower-priority than direct platform, community, or operator intelligence.
Impact Level
medium
Use this briefing to decide whether your team needs an immediate workflow, policy, or reporting change.
Key Stat / Trigger
No single quantitative trigger surfaced in this report.
Focus on the operational implication, not just the headline.
Full Coverage
J. B. Hunt Transport Services’ third quarter may prove to be a speed bump on the road to recovery. The company previously flagged significant cost pressures, some growth-related, heading into the Thursday print. To meet demand, some of its business units offered sign-on bonuses and increase driver recruitment spending.
Some costs appear transitory, while others may linger through the end of the year. J. B. Hunt (NASDAQ: JBHT) reported third-quarter revenue of $3. 68 billion, which was 20% higher year over year and ahead of the $3. 59 billion consensus estimate. Earnings per share of $1. 82 were 6 cents higher y/y and 1 cent above analysts’ lowered expectations.
(A higher tax rate was a 4-cent EPS headwind in the period, partially offset by a 2-cent decline in net interest expense.) Table: J. B. Hunt’s key performance indicators – Consolidated The company identified roughly $45 million in costs at an investor conference in mid-September.
A sharp spike in diesel prices, driver hiring costs and elevated cargo claims forced the company to guide to a 5% to 10% sequential EPS decline in the third quarter (implying $1. 77 at the midpoint of the range). The actual impact from the items totaled over $50 million in the period.
However, management told analysts on a Thursday evening call that “everything [is] playing out like a normal cycle,” noting it is common to incur incremental costs ahead of higher pricing and revenue.
“Any time that we see this pressure happening from a driver environment, [it] typically yields a much better pricing environment for the next bid season,” said President and CEO Shelley Simpson.
The brunt of the cost-price mismatch likely occurred in August and September, and should fade as the magnitude of the cost pressure eases and recent contractual rate wins bleed through to results. It said office headcount was down 4. 5% y/y in the period, as driver count increased 3. 5%. Fuel surcharges operate on a one-week lag.
Diesel prices were up sequentially in nine of the 13 weeks of the third quarter. By month, retail diesel prices dipped 1% sequentially in July, but increased 10% sequentially in August and another 15% in September. The near-term headwind will become an earnings tailwind when prices revert.
The third quarter marked a fifth straight quarter of y/y improvement in operating income and EPS. The company’s earnings turnaround started in the 2025 third quarter, well ahead of peers. Intermodal can exit 2027 operating within margin target range Intermodal revenue increased 20% y/y to $1. 83 billion as loads were up 8.
5% and revenue per load increased 11%. The period was up against an easier volume comparison to a year ago (-1%). By month, shipments grew y/y by 9% in July, 8% in August and 9% in September. Shipments increased 18% y/y in the East and 1% in the transcontinental network. Total intermodal carloads were up 6% y/y on the U. S.
Class I railroads in the period (North American container moves were up 5% y/y). Excluding fuel, revenue per load was up just 2% y/y. However, a 3% decline in length of haul, due to the mix shift to the East, was a modest headwind to yield metric.
Management said it captured low-single-digit contractual rate increase in the 2026 bid season, which ended last month. Table: J. B. Hunt’s key performance indicators – Intermodal Sonar data shows the mode is currently 31% cheaper than truck, which is notably higher than the typical 10% to 15% discount carried in the East (approximately 25% in the West).
Elevated truckload rates and record diesel prices remain ample tailwinds for road-to-rail conversion. SONAR: Intermodal Contract Savings Index (IMCSI. USA). The IMCSI shows the savings percentage between domestic intermodal contract rate per mile and truckload contract rate per mile. The comparison includes fuel surcharges.
To learn more about SONAR, click here. Chart: (ORAILDOML. USA). The daily volume of intermodal containers moving in the United States, Canada and Mexico. The index is a 7-day moving average using the date that containers were in-gated at a point of origin. Intermodal trailers (trailer-on-flatcar) are excluded. The unit booked a 91.
9% operating ratio (inverse of operating margin), which was 15 basis points worse y/y. Higher costs (driver personnel, equipment and employee benefits) led to an 11% increase in cost per load, offsetting the increase in yield. The company’s container fleet was 92. 1% utilized in the quarter, 170 bps better than in the second quarter and well ahead of the 83.
6% utilization rate in the 2025 third quarter. However, average loads per container were down 1% y/y in the period, possibly due to a modest deterioration in rail service. Improved rates and continued cost management could restore margins to the company’s long-term target range of 10% to 12% by the end of next year, management said.
Dedicated a Q3 cost victim The dedicated unit’s OR deteriorated 360 bps y/y to 91. 5%. Revenue increased 11% y/y to $960 million as revenue per truck pe
Original Source
This briefing is based on reporting from Freightwaves. Use the original post for full primary-source context.
Style
Audience