Reported cargo theft rises 5% in Q2 as Southern California remains a hot spot
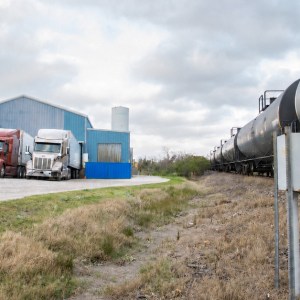
Reported U.S. cargo theft incidents rose 5% in Q2, with California and Texas accounting for more than half of recorded cases. Electronics led targeted commodities, while Southern California remained a major cargo theft hot spot. The post Reported cargo theft rises 5% in Q2 as Southern California remains a hot spot appeared first on FreightWaves.
Source Lens
Industry Context
Useful background context, but lower-priority than direct platform, community, or operator intelligence.
Impact Level
medium
Use this briefing to decide whether your team needs an immediate workflow, policy, or reporting change.
Key Stat / Trigger
No single quantitative trigger surfaced in this report.
Focus on the operational implication, not just the headline.
Full Coverage
Cargo thieves targeted 605 reported loads across the United States during the second quarter, according to a new Overhaul report. That total rose 5% from the first quarter but fell 5% from one year earlier. May produced the highest share, accounting for 35% of quarterly activity. California and Texas remained the largest state-level hot spots.
The cargo-security company recorded an average of about 202 incidents each month from April through June. That equals roughly 6. 7 reported cases daily. Its figures cover thefts reported through sources including law enforcement, insurers and transportation security councils.
They do not capture every cargo crime or standalone thefts of trailers, containers or bobtail tractors. California accounted for 34% of the reports, while Texas represented 18%. Tennessee followed with 13%, Pennsylvania had 10%, and Illinois recorded 8%.
Electronics led California targets, followed by food and drinks, clothing and shoes, and miscellaneous goods. Texas incidents most often involved home and garden products, electronics, and building or industrial materials. Electronics lead targeted commodities Electronics represented 23% of all recorded cases during the quarter.
Miscellaneous cargo ranked next at 20%, while clothing and shoes made up 10%. Those three categories combined for 53% of the activity. Within the electronics category, mixed and miscellaneous shipments led, followed by batteries and panels. window. googletag = window. googletag || {cmd: []}; googletag. cmd. push(function() {googletag.
defineSlot('/21776187881/FW-Responsive-Main_Content-Slot1', [[300, 100], [320, 50], [728, 90], [468, 60]], 'div-gpt-ad-1709668545404-0'). defineSizeMapping(gptSizeMaps. banner1). addService(googletag. pubads()); googletag. pubads(). enableSingleRequest(); googletag. pubads(). collapseEmptyDivs(); googletag. enableServices(); }); googletag. cmd.
push(function() {googletag. display('div-gpt-ad-1709668545404-0'); }); Miscellaneous cargo showed the sharpest rise among the larger product groups. Reports involving that category increased 38% from the first quarter and 84% from the same period last year. Clothing and shoes climbed 25% quarter over quarter and 4% year over year.
Building and industrial freight also increased across both comparisons. Friday accounted for 18% of incidents, the highest share of any day. Early morning activity between midnight and 6 a. m. made up 28% of reports. The next two six-hour periods each held similar shares. That timing leaves little room for a delayed response when a shipment stops moving.
Warehouses, truck stops and rail sites draw attention Pilferage accounted for 46% of the incidents, making it the most common event type. Full truckload theft followed at 21%, while facility theft represented 16%. Deceptive pickup made up 11% of recorded activity. Texas had the largest share of full truckload theft reports.
Warehouses and distribution centers accounted for 37% of locations where the data identified a site. Truck stops and fuel stations followed at 15%, while rail locations represented 11%. California, Tennessee and Texas recorded most warehouse-related cases. Illinois, California, Arizona and Tennessee led rail theft reports.
The report identified Southern California as a major concentration point during the past 12 months. The region within 200 miles of Torrance accounted for 37% of recorded U. S. thefts. The area averaged 81 incidents per month, up 28% from the prior period. Nearly seven in 10 cases occurred within 50 miles of Torrance.
Southern California deceptive pickups rise Pilferage remained the leading method in the Southern California zone, representing 45% of cases. Deceptive pickup increased from 24% to 28% compared with the previous analysis. Warehouse and distribution center locations accounted for 55% of activity there.
Electronics, clothing and shoes, and food and drinks drew the most attention. The report notes that recent reports can increase after publication because incident information often arrives late. Overhaul updates earlier totals when comparing current activity with past periods.
The figures show reported cases, not a complete count of every cargo theft nationwide. window. googletag = window. googletag || {cmd: []}; googletag. cmd. push(function() {googletag. defineSlot('/21776187881/fw-responsive-main_content-slot3', [[728, 90], [468, 60], [320, 50], [300, 100]], 'div-gpt-ad-1665767553440-0'). defineSizeMapping(gptSizeMaps.
banner1). addService(googletag. pubads()); googletag. pubads(). enableSingleRequest(); googletag. pubads(). collapseEmptyDivs(); googletag. enableServices(); }); googletag. cmd. push(function() {googletag.
display('div-gpt-ad-1665767553440-0'); }); Why it matters Cargo theft risk remains concentrated around major freight hubs, but the methods and locations vary widely. Shippers, brokers and carriers need to verify the people, equipment and business behind every shipment before release. CFCO perspective In my opinion, CFCO training gives freig
Original Source
This briefing is based on reporting from Freightwaves. Use the original post for full primary-source context.
Style
Audience