Port of Oakland August volumes fall year over year as exports edge up from July
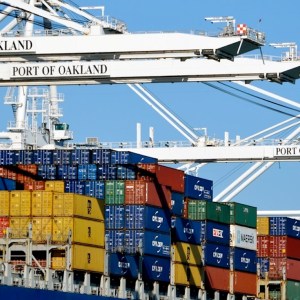
Port of Oakland loaded container volume fell 9% year-over-year in August 2026, with full imports down 4.6% YTD and empty containers (a forward import indicator) down 11.4% YTD. Carriers are shifting vessel rotations to LA-Long Beach and Canadian ports, concentrating capacity away from Oakland.
Carrier consolidation at LA-Long Beach accelerates, squeezing second-tier ports and adding routing complexity for sellers managing Q4 inventory replenishment timelines.
Shrinking empty container returns at Oakland signals weaker import replenishment cycles for sellers sourcing through Northern California 3PLs or using Oakland-routed freight. If your supplier or freight forwarder routes through Oakland, expect tighter vessel availability and potentially longer booking lead times.
Operational Impact
This story may require teams to revisit workflows, monitoring, or platform assumptions.
Bottom Line
Oakland import decline means tighter capacity and longer lead times for sellers using Northern California freight.
Source Lens
Industry Context
Useful background context, but lower-priority than direct platform, community, or operator intelligence.
Impact Level
medium
Oakland import decline means tighter capacity and longer lead times for sellers using Northern California freight.
Key Stat / Trigger
Combined loaded imports and exports at Oakland down 9% year-over-year in August 2026
Focus on the operational implication, not just the headline.
Full Coverage
The Port of Oakland handled 173,818 twenty foot equivalent units (TEUs) in August, with full export volume rising 2. 9% from July, although overall loaded-container traffic remained below the prior-year level. Combined loaded imports and exports totaled 131,666 TEUs during the month, down 9% from August 2025.
Empty-container traffic, frequently an indicator of future imports, reached 42,152 TEUs, a year-over-year decline of 11. 4%, while vessel calls fell to 82 from 90 a year earlier. Year-to-date picture For the first eight months of the year, Oakland’s loaded cargo volume was down 2. 5% from the same period in 2025. Full import volume declined 4.
6%, partly offset by a 0. 2% increase in full exports. Empty-container movements were down 11. 4% year to date. The August export gain from July indicates some month-to-month improvement for a gateway that relies heavily on agricultural and other export cargoes.
But the year-over-year volume decline points up continuing pressure on the broader import-export market, particularly for second-tier West Coast hubs that have seen carriers concentrate services at LA-Long Beach, and shift some vessel rotations to Canada.
Acting Maritime Director Jason Garben said loaded volumes have been relatively stable so far this year, with export traffic running slightly ahead of the 2025 pace. The port plans to work more closely with ocean carriers, shippers and terminal partners to identify new cargo opportunities and attract customers to the Oakland gateway, according to the port.
Read more articles by Stuart Chirls here.
Read more: Ocean rates highest in a year amid US-China trade truce ONE restructures in key ocean region Port Houston container volumes edge higher as steel imports surge 54% Flexport launches MCP Server for AI agents to book freight New limits: More ships can transit this key cargo chokepoint The post Port of Oakland August volumes fall year over year as exports edge up from July appeared first on FreightWaves.
Ask your freight forwarder which port your containers are routing through -- if Oakland, request LA-Long Beach alternatives to access more carrier options and avoid capacity gaps.
In the next 30 days, audit your Q4 inbound shipment bookings: confirm vessel availability and add 1-2 weeks buffer if Oakland is in your routing chain.
Original Source
This briefing is based on reporting from Freightwaves. Use the original post for full primary-source context.
Style
Audience