Knight-Swift again eyes big rate increases as new bid season nears
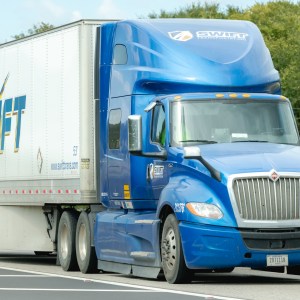
Knight-Swift (KNX) reported Q3 2026 EPS of $0.83 (beat by $0.07) with revenue up 14% YoY, and is targeting double-digit rate increases in its upcoming bid season starting November 2026. Tender rejection rates are running 2-3x industry averages, signaling a tight truckload market with structural capacity constraints.
Regulatory-driven carrier capacity reduction is accelerating freight rate inflation, adding another margin compression vector for sellers already squeezed by platform fees and ad costs -- part of a broader cost-stack tightening across the supply chain.
Tighter truckload capacity and rising contract rates mean inbound freight costs for sellers shipping from manufacturers or 3PLs will increase in Q1 2027 as new bid contracts take effect. Lock in current carrier rates before November bid season resets the floor.
Operational Impact
This story may require teams to revisit workflows, monitoring, or platform assumptions.
Bottom Line
Rising truckload rates in Q1 2027 will compress seller margins if freight costs aren't locked now.
Source Lens
Industry Context
Useful background context, but lower-priority than direct platform, community, or operator intelligence.
Impact Level
medium
Rising truckload rates in Q1 2027 will compress seller margins if freight costs aren't locked now.
Key Stat / Trigger
Tender rejection rates running 2-3x industry average as of Q3 2026
Focus on the operational implication, not just the headline.
Full Coverage
Knight-Swift Transportation is benefitting from its high exposure to one-way truckload, the portion of the market experiencing the largest gains from the regulatory-fueled capacity shakeout.
The carrier said Wednesday, in conjunction with its better-than-expected third-quarter report, that its tender rejections and spot rates are well ahead of industry averages, allowing it to quickly restore margins.
“On the pricing front, our spot pricing trended better than public indicators in the quarter, staying well above contractual rates that continued to accelerate throughout the period,” said CEO Adam Miller in a news release. “Similarly, our tender rejection rates continue to run at levels two to three times that of the broader market measures.”
SONAR: Outbound Tender Rejection Index (OTRI. USA) for 2026 (blue shaded area), 2025 (yellow line), 2024 (green line) and 2023 (pink line). A proxy for truck capacity, the tender rejection index shows the number of loads being rejected by carriers. Current tender rejections show a tight truckload market. To learn more about SONAR, click here.
Knight-Swift (NYSE: KNX) reported third-quarter adjusted earnings per share of 83 cents Wednesday after the market closed. The result was 51 cents higher than the year-ago quarter and 7 cents better than analysts’ expectations. (Management’s EPS guidance range was 71 to 77 cents.) Revenue of $2.
2 billion was up 14% year over year (plus-8% y/y excluding fuel surcharges) and slightly ahead of the $2. 17 billion consensus estimate. window. googletag = window. googletag || {cmd: []}; googletag. cmd. push(function() {var gptSlot = googletag.
defineSlot('/21776187881/FW-Responsive-Main_Content-Slot1', [[300, 100], [320, 50], [728, 90], [468, 60]], 'div-gpt-ad-1709668545404-0'). defineSizeMapping(gptSizeMaps. banner1). addService(googletag. pubads()); googletag. pubads(). enableSingleRequest(); googletag. pubads(). collapseEmptyDivs(); googletag. enableServices(); setInterval(function() {if (!
document. hidden) {googletag. pubads(). refresh([gptSlot]); } }, 60000); }); googletag. cmd. push(function() {googletag. display('div-gpt-ad-1709668545404-0'); }); Table: Knight-Swift’s key performance indicators – Consolidated TL margins turn the corner The company’s TL unit reported a 6. 5% y/y revenue increase, excluding fuel.
Revenue per tractor (ex-fuel) was up 11% y/y while the average tractor count was down 4%. Knight-Swift has been culling its truck fleet through the downturn to improve asset utilization. Loaded miles per tractor increased 1%, which was an eighth straight y/y improvement. Deadhead was down 170 basis points y/y to 12. 1%.
Revenue per loaded mile (ex-fuel) increased 10% y/y. (The metric was up by a mid-teen percentage in its over-the-road service.) Table: Knight-Swift’s key performance indicators – Truckload An 89. 2% adjusted operating ratio (inverse of operating margin) was 700 bps better y/y and in line with the midpoint of management’s guidance range. U. S.
Xpress, which was acquired in 2023, operated at a low-90% adjusted OR in the quarter while Knight-Swift’s legacy brands operated at 88%. Management noted that one-way margins exceeded dedicated margins in the period. (Approximately 29% of Knight-Swift’s TL fleet operates under dedicated contracts.)
The carrier is meaningfully pricing freight above cost inflation. During the first quarter, an increase in revenue per total mile (ex-fuel) lagged the increase in cost per mile (net of fuel surcharges) by 90 bps. The spread flipped to 390 bps positive in the second quarter, with rate gains outpacing cost inflation by 840 bps in the third quarter.
The company is again calling for 650 to 750 bps of y/y TL margin improvement in the fourth quarter, implying an 85. 9% adjusted OR (330 bps better sequentially). Its guidance also calls for revenue to increase y/y by a low-double-digit percentage (ex-fuel).
It said it will look to selectively grow the fleet, but acknowledged “sourcing quality drivers is as challenging as it has been in years.” Knight-Swift’s new bid season kicks off next month and it will ask for “at least double-digit [rate] increases” for starters, Miller said on Wednesday evening call with analysts.
“I think we’ll start the bid season with the idea of probably low-to-mid double digits and see how it develops from there.” window. googletag = window. googletag || {cmd: []}; googletag. cmd. push(function() {var gptSlot = googletag.
defineSlot('/21776187881/fw-responsive-main_content-slot3', [[728, 90], [468, 60], [320, 50], [300, 100]], 'div-gpt-ad-1665767553440-0'). defineSizeMapping(gptSizeMaps. banner1). addService(googletag. pubads()); googletag. pubads(). enableSingleRequest(); googletag. pubads(). collapseEmptyDivs(); googletag. enableServices(); setInterval(function() {if (!
document. hidden) {googletag. pubads(). refresh([gptSlot]); } }, 60000); }); googletag. cmd. push(function() {googletag. display('div-gpt-ad-1665767553440-0'); }); SONAR: Van Contract Rate Per Mile Index (VCRPM1. USA) for 2026 (blu
Contact your 3PL or freight broker now to extend or lock existing contract rates before November bid season -- new contracts will likely reset 10%+ higher.
Audit your landed cost model in the next 30 days: if inbound freight is more than 8% of COGS, reprice SKUs or renegotiate supplier shipping terms before Q1 2027.
Original Source
This briefing is based on reporting from Freightwaves. Use the original post for full primary-source context.
Style
Audience