Schneider National pushes price amid market imbalance
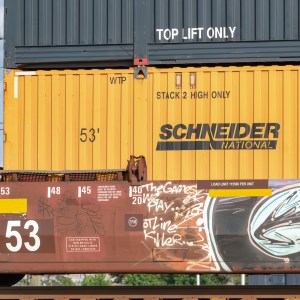
Truckload carrier Schneider National raised its full-year earnings outlook by 18% after easily beating second-quarter expectations. The post Schneider National pushes price amid market imbalance appeared first on FreightWaves.
Source Lens
Industry Context
Useful background context, but lower-priority than direct platform, community, or operator intelligence.
Impact Level
medium
Use this briefing to decide whether your team needs an immediate workflow, policy, or reporting change.
Key Stat / Trigger
No single quantitative trigger surfaced in this report.
Focus on the operational implication, not just the headline.
Full Coverage
Multimodal transportation provider Schneider National handily beat second-quarter expectations and raised its full-year earnings outlook. It said a capacity constrained truckload market is “only in the early stages of rate recovery” and that it will use the favorable imbalance to “recoup multiple years of significant cost inflation.”
Schneider’s (NYSE: SNDR) network fleet (one-way) captured double-digit rate increases on contract renewals in the quarter. Mini-bid activity is up as shippers grow more concerned with securing capacity for peak season. Schneider increased its spot market exposure, noting June closely resembled March 2021, the prior cycle peak.
Schneider reported adjusted earnings per share of 29 cents for the second quarter, which was 6 cents above the consensus estimate and 8 cents higher year over year. Consolidated revenue of $1. 57 billion was 10% higher y/y and better than the $1. 52 billion consensus estimate.
The company raised its full-year adjusted EPS guidance to a range of 90 cents to $1. 10, an 18% increase from its previous outlook (at the midpoints). The 2026 consensus estimate was 96 cents at the time of the print. (The company reported full-year 2025 adjusted EPS of 63 cents.)
“The positive impact of non-compliant capacity exiting the market has been realized more quickly than initially anticipated, and we remain confident that the enterprise will continue to deliver strong operating leverage,” said President and CEO Jim Filter.
Table: Schneider National’s key performance indicators Truckload revenue increased 1% y/y to $628 million as a 5% increase in revenue per truck was partially offset by a 4% decline in average trucks in service. The company said the lower tractor count was largely due to a tighter driver hiring market.
However, improved asset utilization is offsetting the lower truck count. The one-way fleet recorded a 16% y/y increase in revenue per truck per week, with dedicated reporting a 1% increase. It flagged the loss of a large dedicated customer, which will be a headwind in the third quarter. This has been accounted for in the company’s guidance.
It sold dedicated service on 500 new trucks in the first half of the year. It said new dedicated contracts will backfill some of the open trucks from the customer departure, but it may also move some units over to the one-way fleet to take advantage of the spot market. The TL unit reported a 91.
8% operating ratio (inverse of operating margin), which was 180 basis points better y/y. SONAR: Outbound Tender Rejection Index (OTRI. USA) for 2026 (blue shaded area), 2025 (yellow line), 2024 (green line) and 2023 (pink line). A proxy for truck capacity, the tender rejection index shows the number of loads being rejected by carriers.
Current tender rejections show a tight truckload market. To learn more about SONAR, click here. SONAR: National Truckload Index (linehaul only – NTIL. USA) for 2026 (blue shaded area), 2025 (yellow line), 2024 (green line) and 2023 (pink line). The NTIL is based on an average of booked spot dry van loads from 250,000 lanes.
The NTIL is a seven-day moving average of linehaul spot rates excluding fuel. Rates remain significantly higher on a y/y comparison in July. Intermodal revenue slid 1% y/y to $262 million. Revenue per load was down 2% as length of haul declined.
It said the unit has been getting low-single-digit rate increases, but more recent contract renewals are garnering mid-single-digit increases. Finding drayage drivers is getting more difficult, but Schneider isn’t adding third-party operators to chase volume. The intermodal unit reported a 93% OR, 90 bps better y/y.
Logistics revenue increased 11% y/y to $376 million. The unit booked a 96. 8% OR, 90 bps better y/y. Net debt leverage ended the quarter at 0. 2x, down from 0. 3x at the end of 2025. Schneider lowered its full-year net capex plan to a range of $350 million to $400 million as it will purchase fewer trailers than previously planned.
Net capex totaled $289 million in 2025. Why it matters? Schneider National’s results serve as a bellwether for the health of the truckload and intermodal markets. Its commentary on rate recovery and capacity management provides a benchmark for other asset-based carriers.
More FreightWaves articles by Todd Maiden: Saia’s Q3 margin guidance disappoints investors XPO’s Q2 earnings beat expectations behind strong LTL performance ArcBest’s Q2 a step on path to recovery The post Schneider National pushes price amid market imbalance appeared first on FreightWaves.
Original Source
This briefing is based on reporting from Freightwaves. Use the original post for full primary-source context.
Style
Audience