

Imports and inventories stabilize in 2026, but for how long
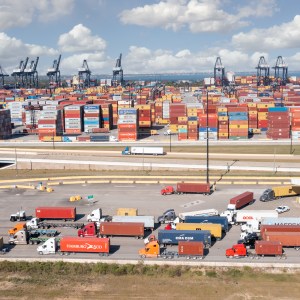
Container import activity has been steady throughout the summer with no sharp shifts in inventories. Recent history suggests that will change. The post Imports and inventories stabilize in 2026, but for how long appeared first on FreightWaves.
Source Lens
Industry Context
Useful background context, but lower-priority than direct platform, community, or operator intelligence.
Impact Level
medium
Use this briefing to decide whether your team needs an immediate workflow, policy, or reporting change.
Key Stat / Trigger
No single quantitative trigger surfaced in this report.
Focus on the operational implication, not just the headline.
Full Coverage
Chart of the Week: Import Ocean TEUs Volume Index – USA, Logistics Managers’ Index – Inventory Levels SONAR: IOTI. USA, LMI. INVL Import bookings (IOTI) have been averaging lower than the previous two years, while inventory levels have been fairly stable according to the Logistics Managers’ Index (LMI).
Bookings activity combined with inventory data points to a steady but tight inventory management environment — one of the tightest of the post-COVID era. This also means many companies may be exposed to missed revenue in the fourth quarter as they try to mitigate the rising costs of holding too much for too long.
The IOTI is an index that measures bookings of container imports with a 14-day moving average. Like most indexes, its use case is directional, and the current direction is flatter than in any of the previous four years. The inventory level component of the LMI measures how quickly survey respondents are reporting expanding or contracting inventories.
Readings above 50 indicate expansion, while values below 50 indicate contraction. This past year has been one of the most stable in recent history, peaking in June at 60. 5 and hitting its 2026 low in August at 52. 8. Seasonal fluctuations are normal, as shippers go through restocking and destocking periods throughout the year.
These peaks and valleys can tell us how successful they have been in forecasting demand. The relative flatness indicates they have been extremely efficient in optimizing inventory.
In late 2021, bookings were already relatively high, as shippers were facing significant supply chain challenges that eased rapidly in 2022, when demand fell and their over-ordering strategy caught up with them. The LMI inventory level reading went from 58. 8 in November 2021 to 80. 18 in February 2022.
Importers did not shift their strategy until that summer, when the IOTI fell nearly 40% from June to October. The IOTI remained subdued into mid-2023 while inventory levels contracted. The great destocking waned in late 2023 and was replaced in 2024 by a period of rebuilding.
The IOTI averaged nearly 15% higher in 2024, while the LMI closed the year averaging a healthy expansion reading.
Tariffs and erratic trade policy heavily influenced 2025, with the IOTI spiking to COVID-era highs in summer, then plummeting in fall, netting an expansionary inventory situation until the end of the year, when inventory levels contracted at the fastest pace in the index’s history.
This past year has been far less chaotic, but possibly no less nerve-racking, as shippers navigate rapidly expanding transportation and inventory costs in a very shaky consumer environment. Politics have become increasingly intertwined with economics, making many uneasy about the state of things despite the aggregate figures painting a fairly stable picture.
So far, taking a down-the-middle approach to ordering and expectations has worked well in aggregate. The IOTI and LMI figures have been historically consistent, indicating that businesses are selling about as much as they are ordering. This works well in a stable economy, but it is a fine line to walk.
This year’s holiday season is one of the most challenging to predict — one that has left the nation’s top economic minds struggling amid all the moving parts. Looking at the chart above, history would be a poor predictor of what happens next, as each of the past five years has looked nothing like the one before it.
Shippers will have to decide whether simply doing more of the same makes sense, but it would be wise to monitor the situation closely and have contingencies ready so they can react quickly if they want to close out the year on the right foot.
About the Chart of the Week The FreightWaves Chart of the Week is a chart selection from SONAR that provides an interesting data point to describe the state of the freight markets. A chart is chosen from thousands of potential charts on SONAR to help participants visualize the freight market in real time.
Each week a Market Expert will post a chart, along with commentary, live on the front page. After that, the Chart of the Week will be archived on FreightWaves. com for future reference.
SONAR aggregates data from hundreds of sources, presenting the data in charts and maps and providing commentary on what freight market experts want to know about the industry in real time. The FreightWaves data science and product teams are releasing new datasets each week and enhancing the client experience. To request a SONAR demo, click here.
The post Imports and inventories stabilize in 2026, but for how long appeared first on FreightWaves.
Original Source
This briefing is based on reporting from Freightwaves. Use the original post for full primary-source context.
Style
Audience