

SONAR Sitrep: Retailers roll back customer pick-up, reallocate freight
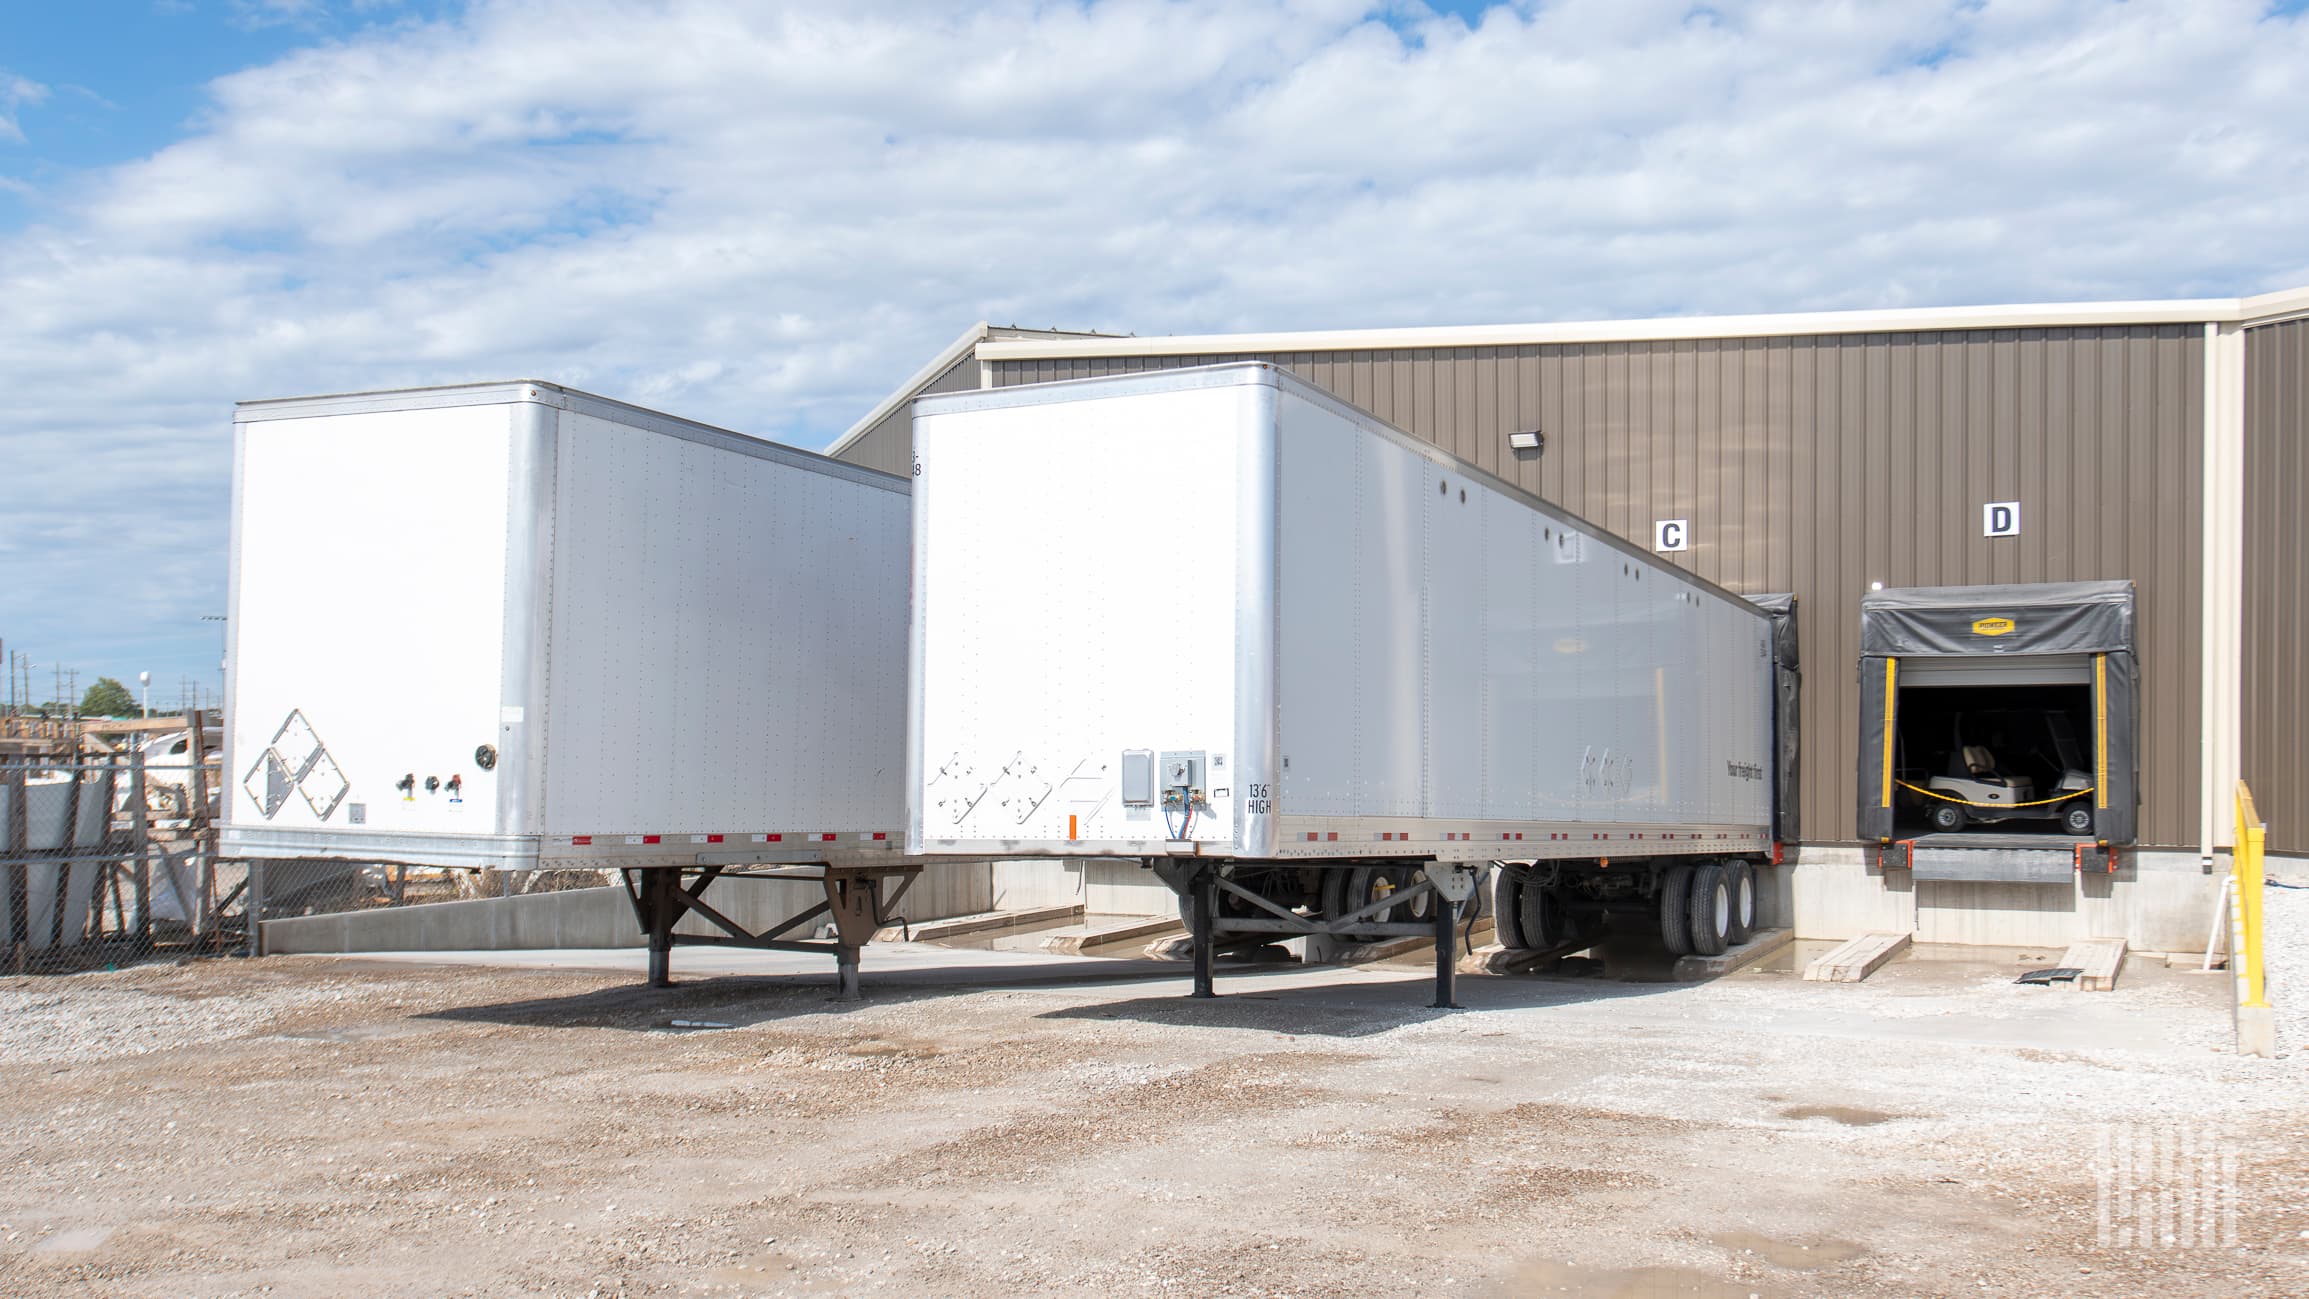
As the freight market undergoes a rapid reallocation of transportation responsibility, customer pick-up arrangements are reversing and causing incremental rate increases. The post SONAR Sitrep: Retailers roll back customer pick-up, reallocate freight appeared first on FreightWaves.
Source Lens
Industry Context
Useful background context, but lower-priority than direct platform, community, or operator intelligence.
Impact Level
medium
Use this briefing to decide whether your team needs an immediate workflow, policy, or reporting change.
Key Stat / Trigger
No single quantitative trigger surfaced in this report.
Focus on the operational implication, not just the headline.
Full Coverage
Between 20% and 45% of outbound truckload volume for mid-to-large consumer packaged goods (CPG) shippers moves under Customer Pick-Up (CPU) arrangements in soft markets. But as the freight market undergoes a rapid reallocation of transportation responsibility, these arrangements are reversing –often with little to no warning.
As the freight cycle recovers and capacity tightens, CPG shippers are confronting a sudden wave of returned freight volume that is reshaping procurement budgets. During prolonged loose markets, retailers utilize their consolidated scale to capture lower transportation rates.
However, when contract carrier rejection rates climb and spot rates compress toward contract rates, the economic arbitrage that favors retailer-managed transportation breaks down. Retailers then begin systematically suspending CPU programs on high-cost corridors and seasonal lanes, dumping the procurement and operational burdens back onto manufacturers.
window. googletag = window. googletag || {cmd: []}; googletag. cmd. push(function() {googletag. defineSlot('/21776187881/FW-Responsive-Main_Content-Slot1', [[300, 100], [320, 50], [728, 90], [468, 60]], 'div-gpt-ad-1709668545404-0'). defineSizeMapping(gptSizeMaps. banner1). addService(googletag. pubads()); googletag. pubads().
enableSingleRequest(); googletag. pubads(). collapseEmptyDivs(); googletag. enableServices(); }); googletag. cmd. push(function() {googletag.
display('div-gpt-ad-1709668545404-0'); }); The impact This transition is showing up clearly in high-frequency FreightWaves SONAR indices, signaling that an active reversal regime is already underway: Contract Tender Rejections (STRI. USA): The national Outbound Tender Rejection Index has climbed to 13. 16% (6-month average: 10.
87%), placing the market squarely in the “Active Reversal” phase. In major distribution hubs like Chicago, the regional index (STRI. CHI) sits at 10. 57% (6-month average: 8. 43%), pointing to sustained pressure on carrier acceptance. The Spot-to-Contract Rate Spread (Rates. USA): This index has compressed sharply to -$0.
22/mile from its 6-month average of -$0. 36/mile, indicating that the linehaul spot-to-contract gap is rapidly closing. Currently, the linehaul spot rate (NTIL. USA) stands at $2. 26/mile (15. 3% above its 6-month average of $1. 96/mile), while the Van Contract Rate Per Mile (VCRPM1. USA) is at $2. 48/mile.
When this spread crosses zero, broad CPU suspensions typically follow within weeks. Tender Volume Expansion (STVI. USA): The national volume index has surged to 11,872, running 10. 4% above its 6-month average of 10,755. This rise confirms that returned CPU volume is already entering shipper TMS platforms as newly tendered outbound freight.
Notably, the Chicago volume index (STVI. CHI) at 232. 46 remains below its 6-month average of 255. 16, indicating that regional Midwest corridors are lagging behind the national volume return but represent the next major wave of local tightening. All-In Spot Costs (NTI. USA): Shippers forced onto the spot market face an all-in rate of $3.
08/mile (including fuel), compared to a 6-month average of $2. 65/mile, adding an immediate premium to returned loads. The financial fallout of a CPU reversal is severe. Direct weekly incremental freight rate increases for small shippers ($150M revenue) range from $8,000 to $24,000 per week.
Large shippers ($2B revenue) face $100,000 to $240,000 per week in added transportation costs. For mega-shippers ($8B revenue), the direct freight premium alone scales to a massive $260,000 to $900,000 per week. And direct linehaul rates are only the tip of the iceberg.
When modeling the full “cost stack” for a mid-size CPG shipper ($500M revenue) receiving 35 to 55 returned loads weekly, the total impact is staggering. In total, a mid-size shipper faces a combined weekly burden of $15,188 to $47,250 –representing an annualized budget shock of $790,000 to $2. 46 million.
Stay ahead of the curve Want to understand how shifting CPU economics and high-frequency rate trends could impact your capacity strategy and transportation budget? The full sitrep is available to SONAR subscribers and FreightWaves Market Monitor subscribers. [Access via SONAR] | [Access via FreightWaves Market Monitor] window. googletag = window.
googletag || {cmd: []}; googletag. cmd. push(function() {googletag. defineSlot('/21776187881/fw-responsive-main_content-slot3', [[728, 90], [468, 60], [320, 50], [300, 100]], 'div-gpt-ad-1665767553440-0'). defineSizeMapping(gptSizeMaps. banner1). addService(googletag. pubads()); googletag. pubads(). enableSingleRequest(); googletag. pubads().
collapseEmptyDivs(); googletag. enableServices(); }); googletag. cmd. push(function() {googletag. display('div-gpt-ad-1665767553440-0'); }); The full report includes deeper dives into: The CPU Market Cycle: Detailed operational modeling of the four distinct phases of the freight cycle and when retailers pull the trigger on rollbacks.
The Stale Contract Problem: Why multi-year CPU exposure leaves carrier rela
Original Source
This briefing is based on reporting from Freightwaves. Use the original post for full primary-source context.
Style
Audience