

U.S. container imports climb 3.8% to 2.6 million TEUs, 3rd highest monthly level
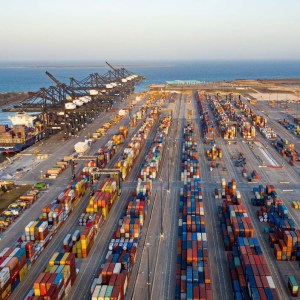
Imports climbed 3.8% from July to 2.60 million TEUs as gains at East, Gulf and West Coast gateways coincided with a broad increase in sourcing-market volumes and rising port transit delays. The post U.S. container imports climb 3.8% to 2.6 million TEUs, 3rd highest monthly level appeared first on FreightWaves.
Source Lens
Industry Context
Useful background context, but lower-priority than direct platform, community, or operator intelligence.
Impact Level
medium
Use this briefing to decide whether your team needs an immediate workflow, policy, or reporting change.
Key Stat / Trigger
No single quantitative trigger surfaced in this report.
Focus on the operational implication, not just the headline.
Full Coverage
U. S. containerized imports rose 3. 8% from July to 2. 60 million TEUs in August, supported by higher volumes at major East, Gulf and West Coast ports and broad gains across sourcing countries. Imports climbed 3. 8% from July to 2.
60 million TEUs as gains at East, Gulf and West Coast gateways coincided with a broad increase in sourcing-market volumes and rising port transit delays.
Import volume reached 2,603,709 twenty-foot equivalent units (TEUs) in August, the third-highest monthly volume on record, as shippers moved more cargo through major gateways despite growing uncertainty over tariffs, Middle East shipping disruptions and new Panama Canal capacity constraints. Imports rose 3. 8% from July and 3.
3% from August 2025, according to Descartes Datamyne data. Only May 2022, when imports totaled 2,622,465 TEUs, and July 2025, with 2,621,910 TEUs, produced larger monthly volumes. window. googletag = window. googletag || {cmd: []}; googletag. cmd. push(function() {var gptSlot = googletag.
defineSlot('/21776187881/FW-Responsive-Main_Content-Slot1', [[300, 100], [320, 50], [728, 90], [468, 60]], 'div-gpt-ad-1709668545404-0'). defineSizeMapping(gptSizeMaps. banner1). addService(googletag. pubads()); googletag. pubads(). enableSingleRequest(); googletag. pubads(). collapseEmptyDivs(); googletag. enableServices(); setInterval(function() {if (!
document. hidden) {googletag. pubads(). refresh([gptSlot]); } }, 30000); }); googletag. cmd. push(function() {googletag. display('div-gpt-ad-1709668545404-0'); }); The August total was also 21. 5% above the pre-pandemic level recorded in August 2019. While cumulative imports through the first eight months of 2026 remained down 0.
4% from the same period a year earlier, the August gain narrowed the year-to-date deficit and pointed to resilient late-summer import demand. The month-over-month increase was notable because it reversed July-to-August declines recorded in both 2024 and 2025. It also came as importers face a more complicated operating environment, including expanded U. S.
tariff exposure, disruption around the Strait of Hormuz, elevated Red Sea security risk and reduced Panama Canal transit availability. Port volumes broaden The nation’s 10 largest container gateways handled 84. 6% of U. S. containerized imports in August and collectively increased volume by 80,661 TEUs, or 3. 8%, from July.
Eight of the 10 ports posted monthly gains. New York/Newark recorded the largest increase, up 24,122 TEUs, or 7. 2%, from July. Savannah followed with a gain of 22,761 TEUs, or 9. 2%, while Long Beach increased by 12,945 TEUs, or 2. 8%. In the Gulf region, Houston posted an 8,569-TEU increase, up 4. 7%. New York-New Jersey gained 8,548 TEUs, or 18. 1%.
Charleston rose 5,751 TEUs, Tacoma increased 4,829 TEUs and Norfolk added 511 TEUs. Only Oakland and Los Angeles reported volume declines among the top 10 gateways. Oakland fell 5,628 TEUs, or 7. 4%, and Los Angeles slipped 1,748 TEUs, or 0. 4%. window. googletag = window. googletag || {cmd: []}; googletag. cmd. push(function() {var gptSlot = googletag.
defineSlot('/21776187881/fw-responsive-main_content-slot3', [[728, 90], [468, 60], [320, 50], [300, 100]], 'div-gpt-ad-1665767553440-0'). defineSizeMapping(gptSizeMaps. banner1). addService(googletag. pubads()); googletag. pubads(). enableSingleRequest(); googletag. pubads(). collapseEmptyDivs(); googletag. enableServices(); setInterval(function() {if (!
document. hidden) {googletag. pubads(). refresh([gptSlot]); } }, 30000); }); googletag. cmd. push(function() {googletag. display('div-gpt-ad-1665767553440-0'); }); The distribution of the gains helped East and Gulf Coast ports regain some share of total U. S. import volume. They accounted for 40. 7% of imports in August, up from 39. 8% in July.
West Coast ports accounted for 43. 9%, down from 45% a month earlier. The shift was modest but reflected the outsized August gains at New York/Newark and Savannah, two of the country’s largest East Coast gateways.
Delays rise at every major gateway Stronger throughput was accompanied by higher transit delays across all 10 major ports, according to the report. Houston and Seattle registered the biggest increases. Houston’s average delay rose 1. 5 days, from 4. 3 days to 5. 8 days, while Seattle increased by the same amount, from 6. 1 days to 7. 6 days.
Savannah’s delay rose 1. 3 days to 6. 1 days. window. googletag = window. googletag || {cmd: []}; googletag. cmd. push(function() {var gptSlot = googletag. defineSlot('/21776187881/fw-responsive-main_content-slot4', [[300, 100], [320, 50], [728, 90], [468, 60]], 'div-gpt-ad-1709668086344-0'). defineSizeMapping(gptSizeMaps. banner1). addService(googletag.
pubads()); googletag. pubads(). enableSingleRequest(); googletag. pubads(). collapseEmptyDivs(); googletag. enableServices(); setInterval(function() {if (! document. hidden) {googletag. pubads(). refresh([gptSlot]); } }, 30000); }); googletag. cmd. push(function() {googletag.
display('div-gpt-ad-1709668086344-0'); }); Los Angeles, Norfolk, New York-New Jersey, Tacoma, Oak
Original Source
This briefing is based on reporting from Freightwaves. Use the original post for full primary-source context.
Style
Audience